Graph-structured representations for VQA
This paper is one of the earliest works that leverages graphical structured representations multimodal learning. It introduces how to store the image and the questionas graphical structures and how to find the features of both the modalities using graph neural networks.
Graph Representations
In this section we look at how the images and questions are constructed into graphs to be processesed via graph neural networks.
Language
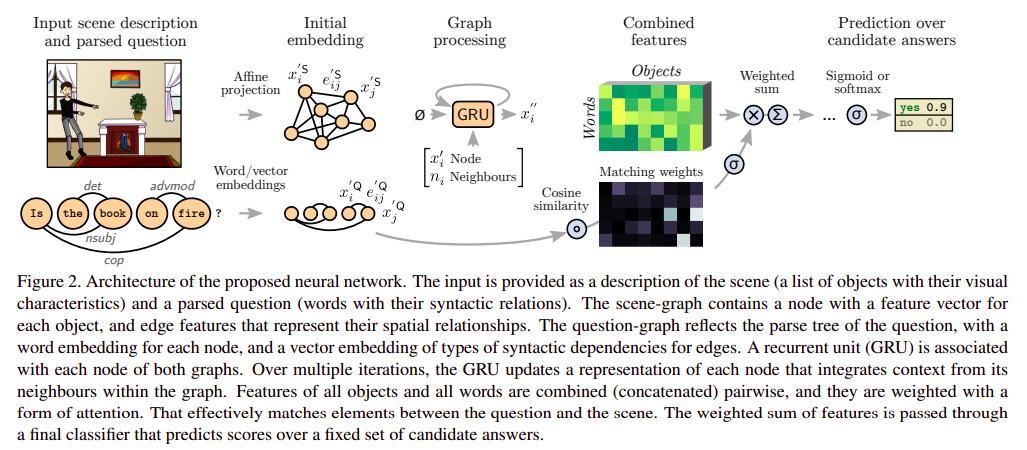
The input data for each training or test instance is a question, and a parame-terized description of contents of the scene. The question is processed with the Stanford dependency parser, which outputs the following.
-
A set of \(N_Q\) words that constitute the nodes of the question graph. Each word is represented by its index in the input vocabulary, a token \(x_i^Q \in Z, \textit{ for } i \in 1...N_Q\)
-
A set of pairwise relations between words, which constitute the edges of the graph. An edge between words \($i\) and \(j\) is represented bye \(Q_{ij} \in Z\), an index among the possible types of dependencies.
Vision
The dataset provides the following information about the image
-
A set of \(N^S\) objects that constitute the nodes of the scene graph. Each node is represented by a vector \(x_i^S \in R^C\) of visual features \((i \in 1..N^S)\)
-
A set of pairwise relations between all objects. They form the edges of a fully-connected graph of the scene. The edge between objects \(i\) and \(j\) is represented by a vector \(e^S_{ij} \in R^D\) that encodes relative spatial relationships.
Processing on the graphs
Obtaining the feature representations from Graphical Structures
The feature vectors of all the nodes and the edges are projected to a common dimensional space using different projection matrices.
The graphs for both the image and the question are processed using a recurrent neural network, a GRU here, after combining the effect from all the nearby nodes. For each object \(i\) of any of the two graphs, the process can be written mathematically as
\[h_i^0 = 0\] \[n_i = pool_j(e'_{ij} \cdot x'_j)\] \[h_i^t = \mathbf{GRU}(h_i^{t-1}, [x'_i; n_i])\]where \([;]\) represents the concatenation of the vectors and \(\cdot\) represents the Hadamard product. Average pooling is found the best in this paper’s implementation. The final features for each node (an object in case of visual modality and a word in case of linguistic modality) are obtained by taking the output from the final state of the GRU. Mathematically,
\[x''_i = h_i^T\]Fusion through Cross-Attention and Classification
The fusion can be divided into three parts as:
- Feature representation for each of the object-word pairs: This is obtained by simply concatenating the feature vector of both the object and the word. Mathematically for word \(i\) and object \(j\), combined features \(y_{ij}\):
- Ranking through cross-attention: A formulation similar to cosine similarity with learned weights is used to find the relevance between each pair of object and word nodes. Note, that the unprocessed nodes of the graph are used to calculate the relevance score.
- Collection of ranked features: The ranked features or say attended features are collected, first by summing across all the objects and then by summing across all the words to give a single feature vector.
\(y''\) are the predicted scores for the answer classification.
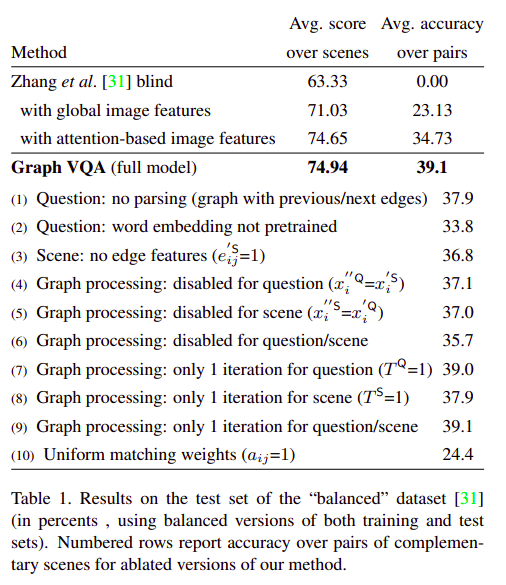
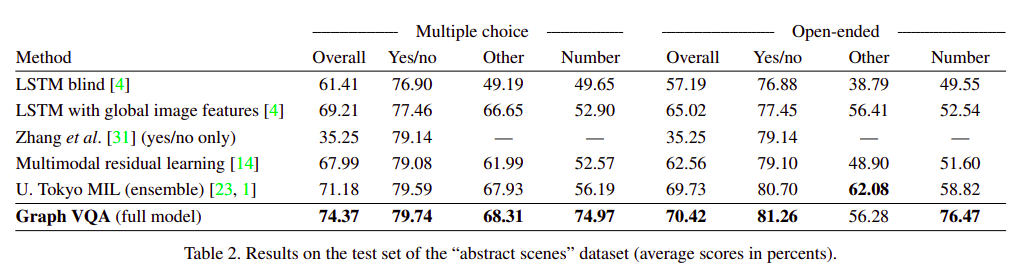
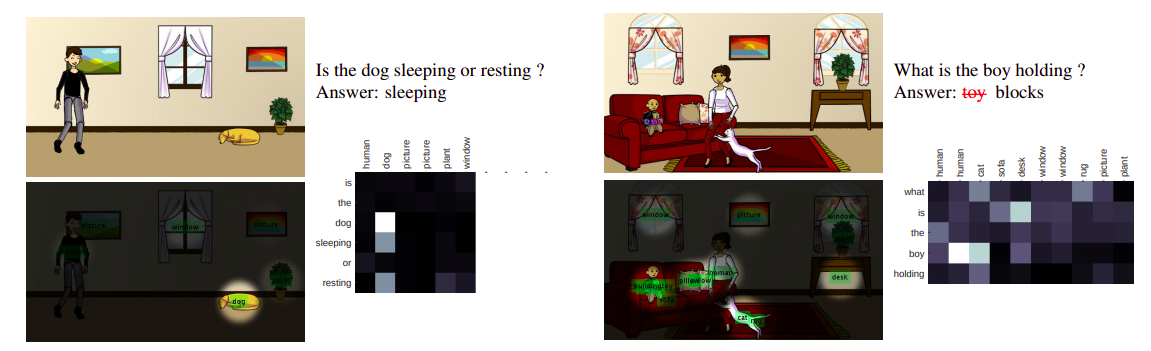
Experiments, Ablations and Results
The authors of the paper evaluate their paper on the original Abstract Scenes dataset for visual question answering and it’s balanced extension. The results, ablations and a few examples are described in the following images.
References
- Teney, D., Liu, L., & Hengel, A. (2016). Graph-Structured Representations for Visual Question AnsweringarXiv e-prints, arXiv:1609.05600.